
For the 2022 midterms, two interesting things happened: Texas redistricted in a way that unified much of Central and West Austin into a new, consolidated district and a good friend of mine decided to enter the Primaries to represent that district.

I produced a few pieces during the campaign, the most interesting for me was an interactive district map. As we spoke to potential voters, many — myself included — wondered, “am I even in this district?”
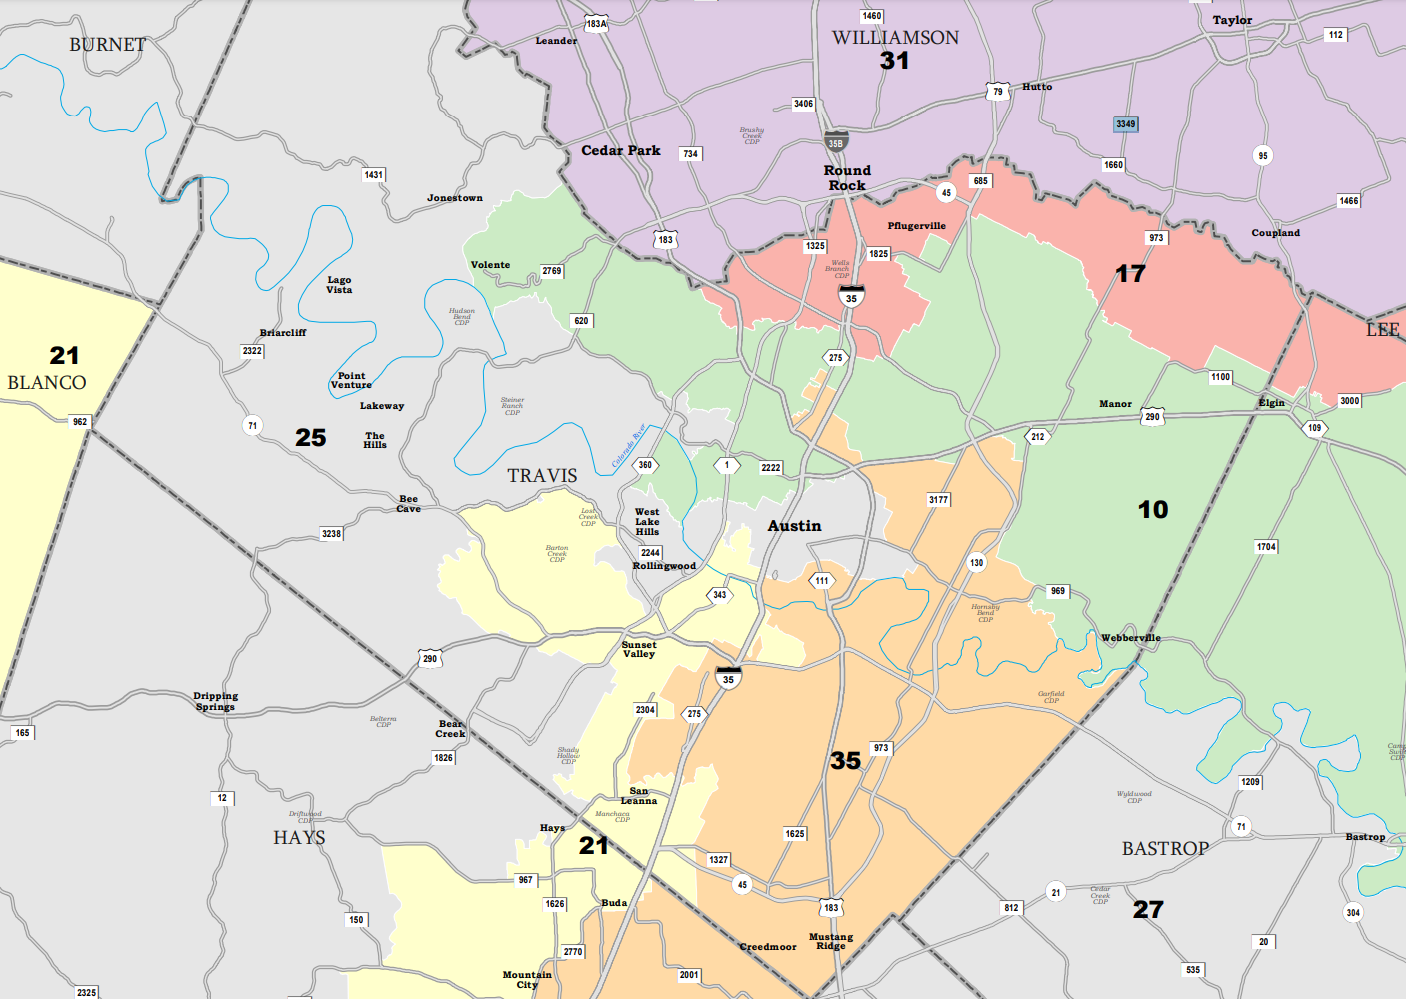
I watched as a well-informed friend used the map on her phone to discover, “Oh wow, I thought I was still in the 25th. And if I didn’t know…” Our collective confusion is warranted; the last time our legislature picked their own voters, they divvied up Austin this way:
Finding the Data
Texas posted the new maps on its redistricting website. Senate Bill 6, designated “PlanC2193,” is available as a map and a collection of downloads. One of those is a Shapefile, a vector geography format for GIS software.
Having recently done another deep dive on interactive mapping, this seemed like a simple job for Mapbox. Here’s the overview:
  graph TD

  DESIGN(Custom Map Design)
  SHAPE(Senate Shapefile) --> TILES(Mapbox Tileset)

  DESIGN ---> STUDIO(Mapbox Studio)
  TILES --> STUDIO

  STUDIO ----> STATIC(Static Images)
  STUDIO ---> WEB(Website)

  TILES <---> TQ(Tilequery API)
  TQ <---> WEB

  style DESIGN stroke:#000099,fill:#eef
  style STUDIO stroke:#000099,fill:#eef
  style SHAPE stroke:#990000,fill:#fee
  style TILES stroke:#990000,fill:#fee
  style WEB stroke:#009900,fill:#efe
  style STATIC stroke:#009900,fill:#efe
Making a Tileset of Districts
Mapbox Studio can import a Shapefile as a custom Tileset.
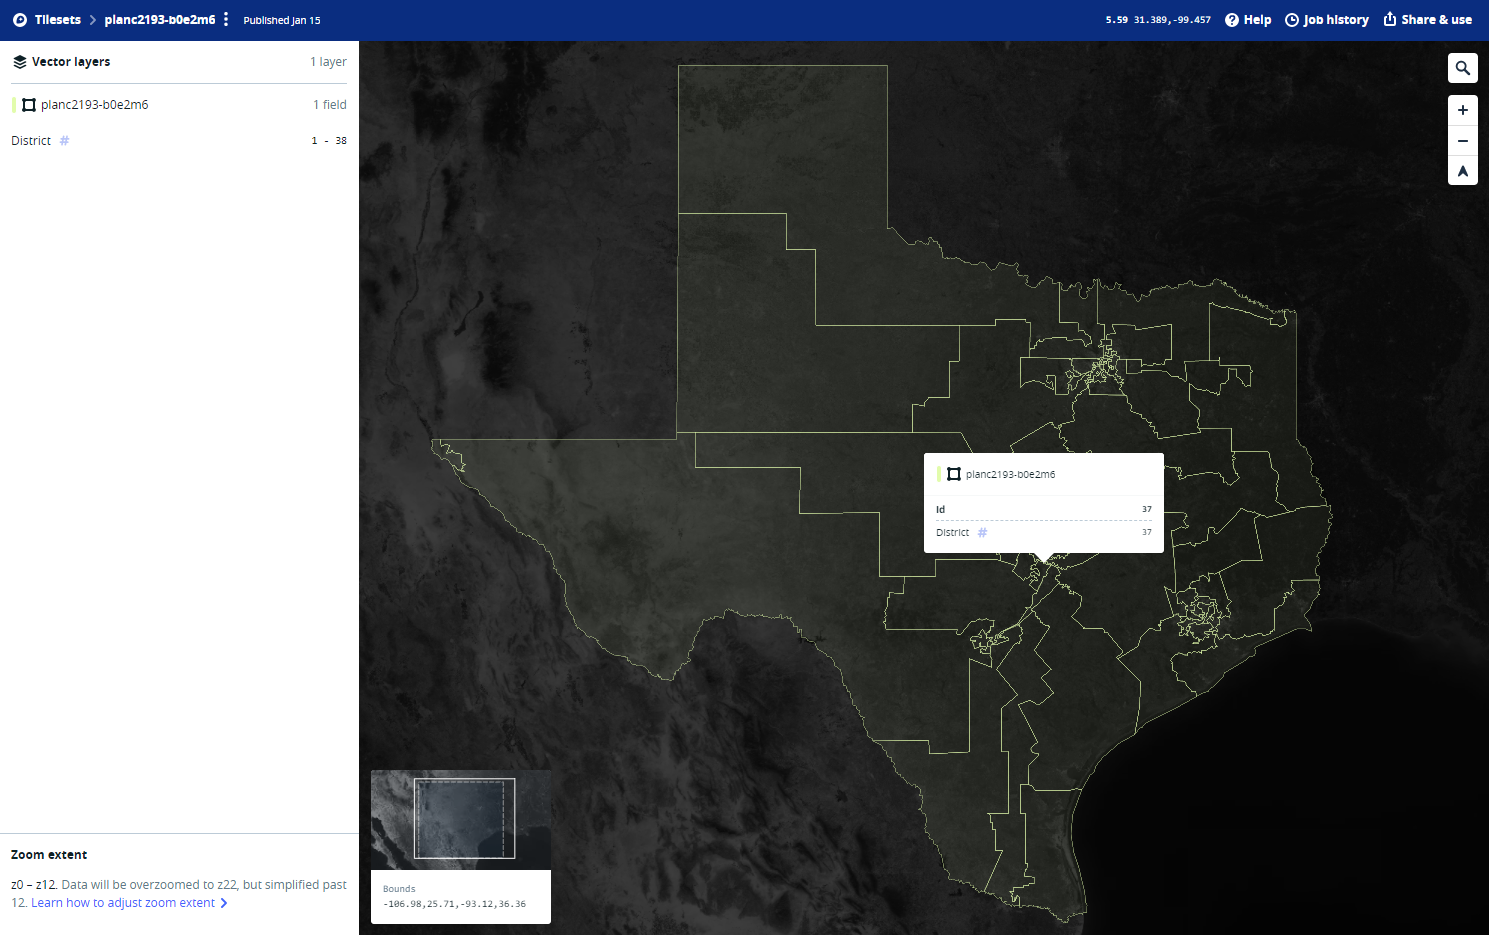
This let me do two things:
- Add and stylize district boundaries on the map
- Look up the district for a given location using the Tilequery API
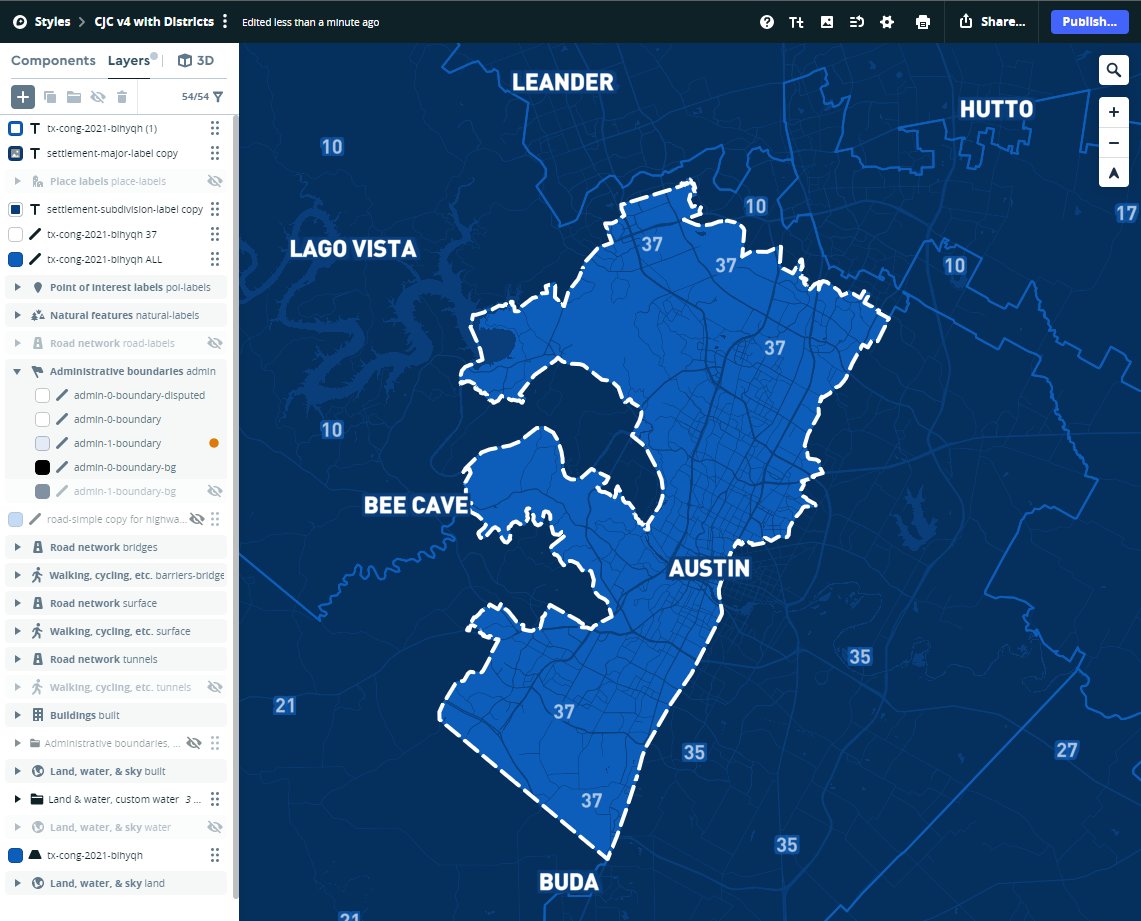
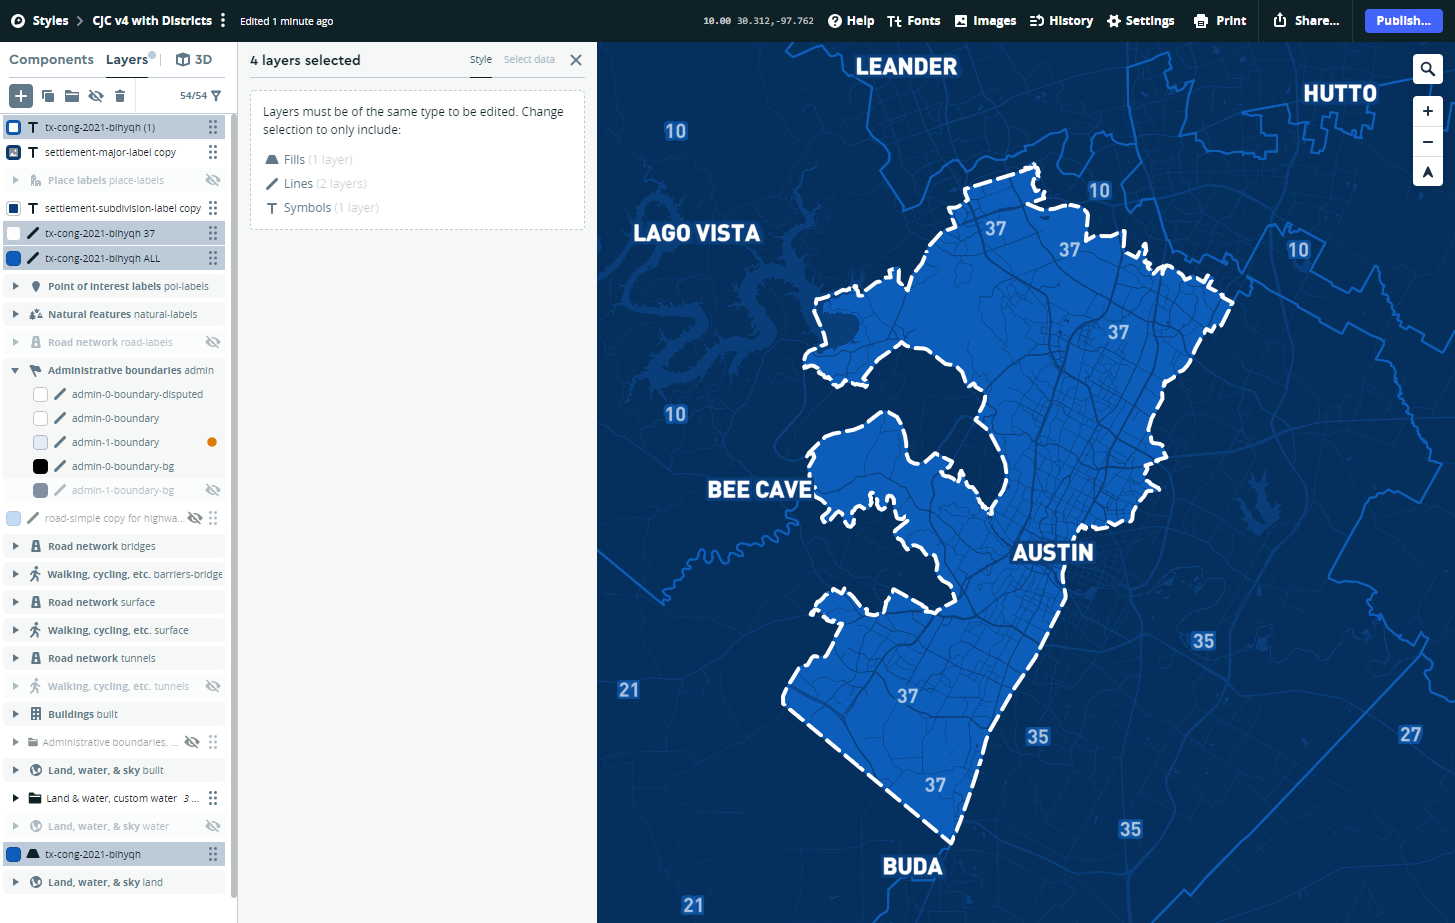
Designing a Branded Map
I started with a Mapbox Gallery example, then customized it to better match the campaign’s identity and simplify some elements.
I used the tileset to draw and label each district, with additional emphasis on the 37th.
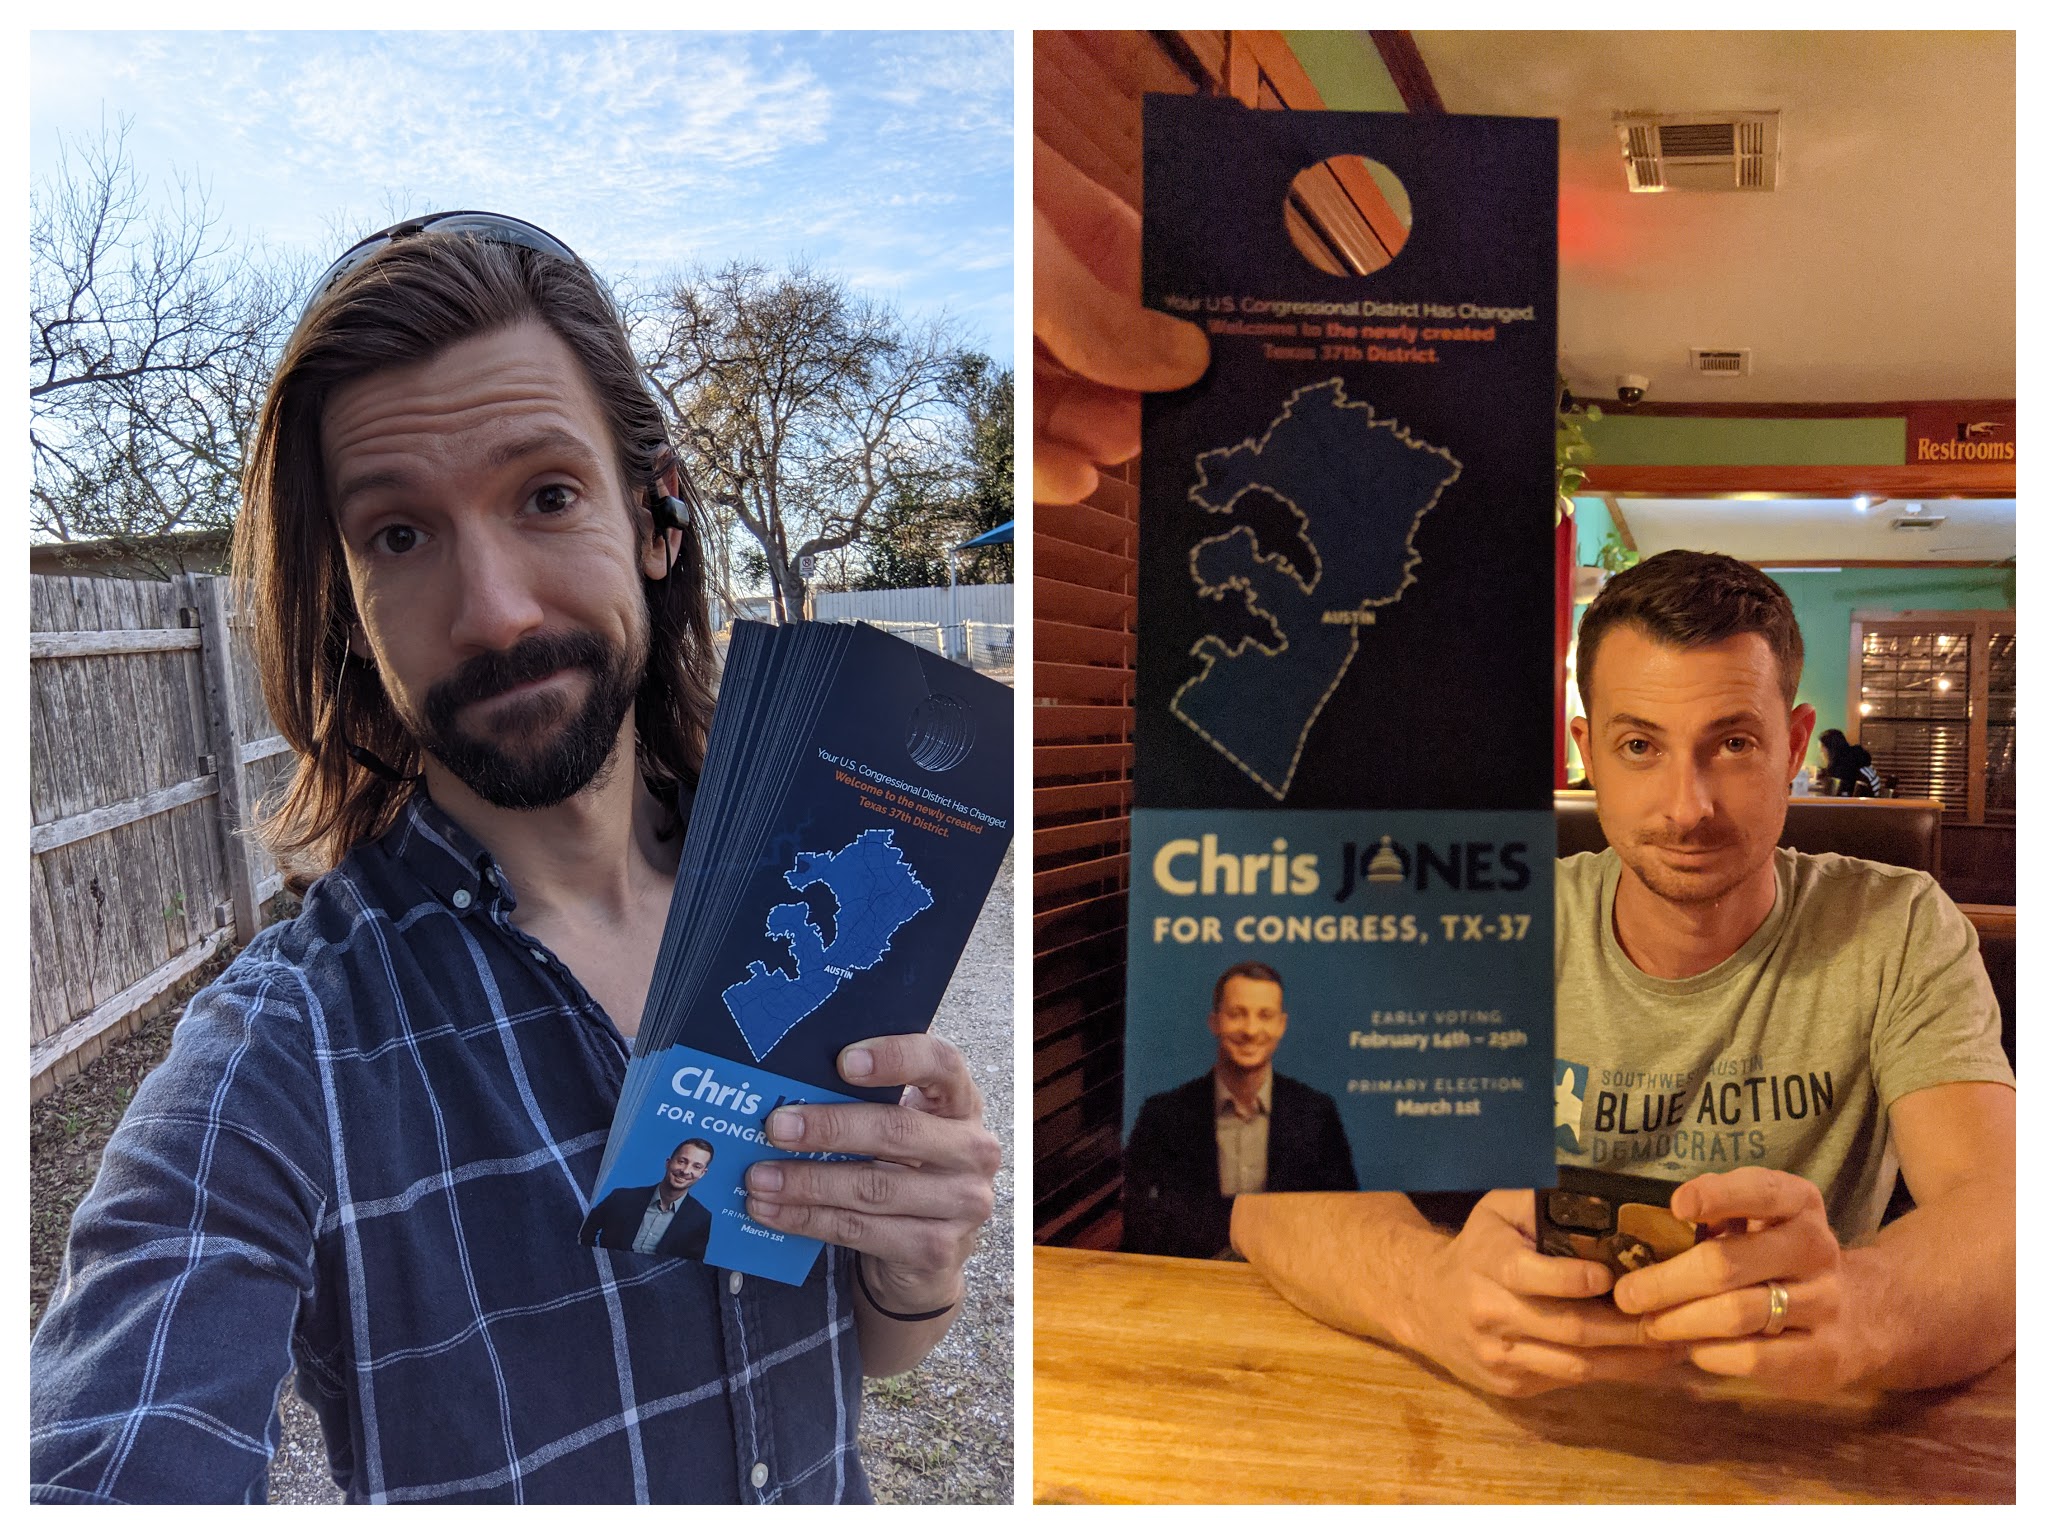
Printed Output
From there, Mapbox allows a limited number of extremely high-resolution raster exports, which we used for social media and print pieces like door hangers.
From one of the door-to-door canvassing days:
Creating the Map Site
I used Parcel.js as a simple build tool that would collect and transpile the Mapbox JS/CSS, my TypeScript, light SCSS, and some repetitive HTML. On build, it generates a static site that users can access directly or as an embed on the official campaign website on Wix.
The Base Map
Loading a map into an HTML element is easy: just add a container like
<div id='map'></div> to a page and target it when initializing a Map()
instance. In the Map object options here, I also disabled the 3D tilt and
rotation because my map style is flat.
  import { Map } from 'mapbox-gl';
  const accessToken = '...';
  const mapStyleId = '...';

  const map = new Map({
    accessToken,
    container: 'map',
    style: `mapbox://styles/tsmith512/${mapStyleId}`,
    center: [-97.74, 30.27],
    zoom: 10,

    // Disable mapbox 3D tilt and rotation
    pitch: 0,
    minPitch: 0,
    maxPitch: 0,
    pitchWithRotate: false,
    touchPitch: false,
    dragRotate: false,
  });
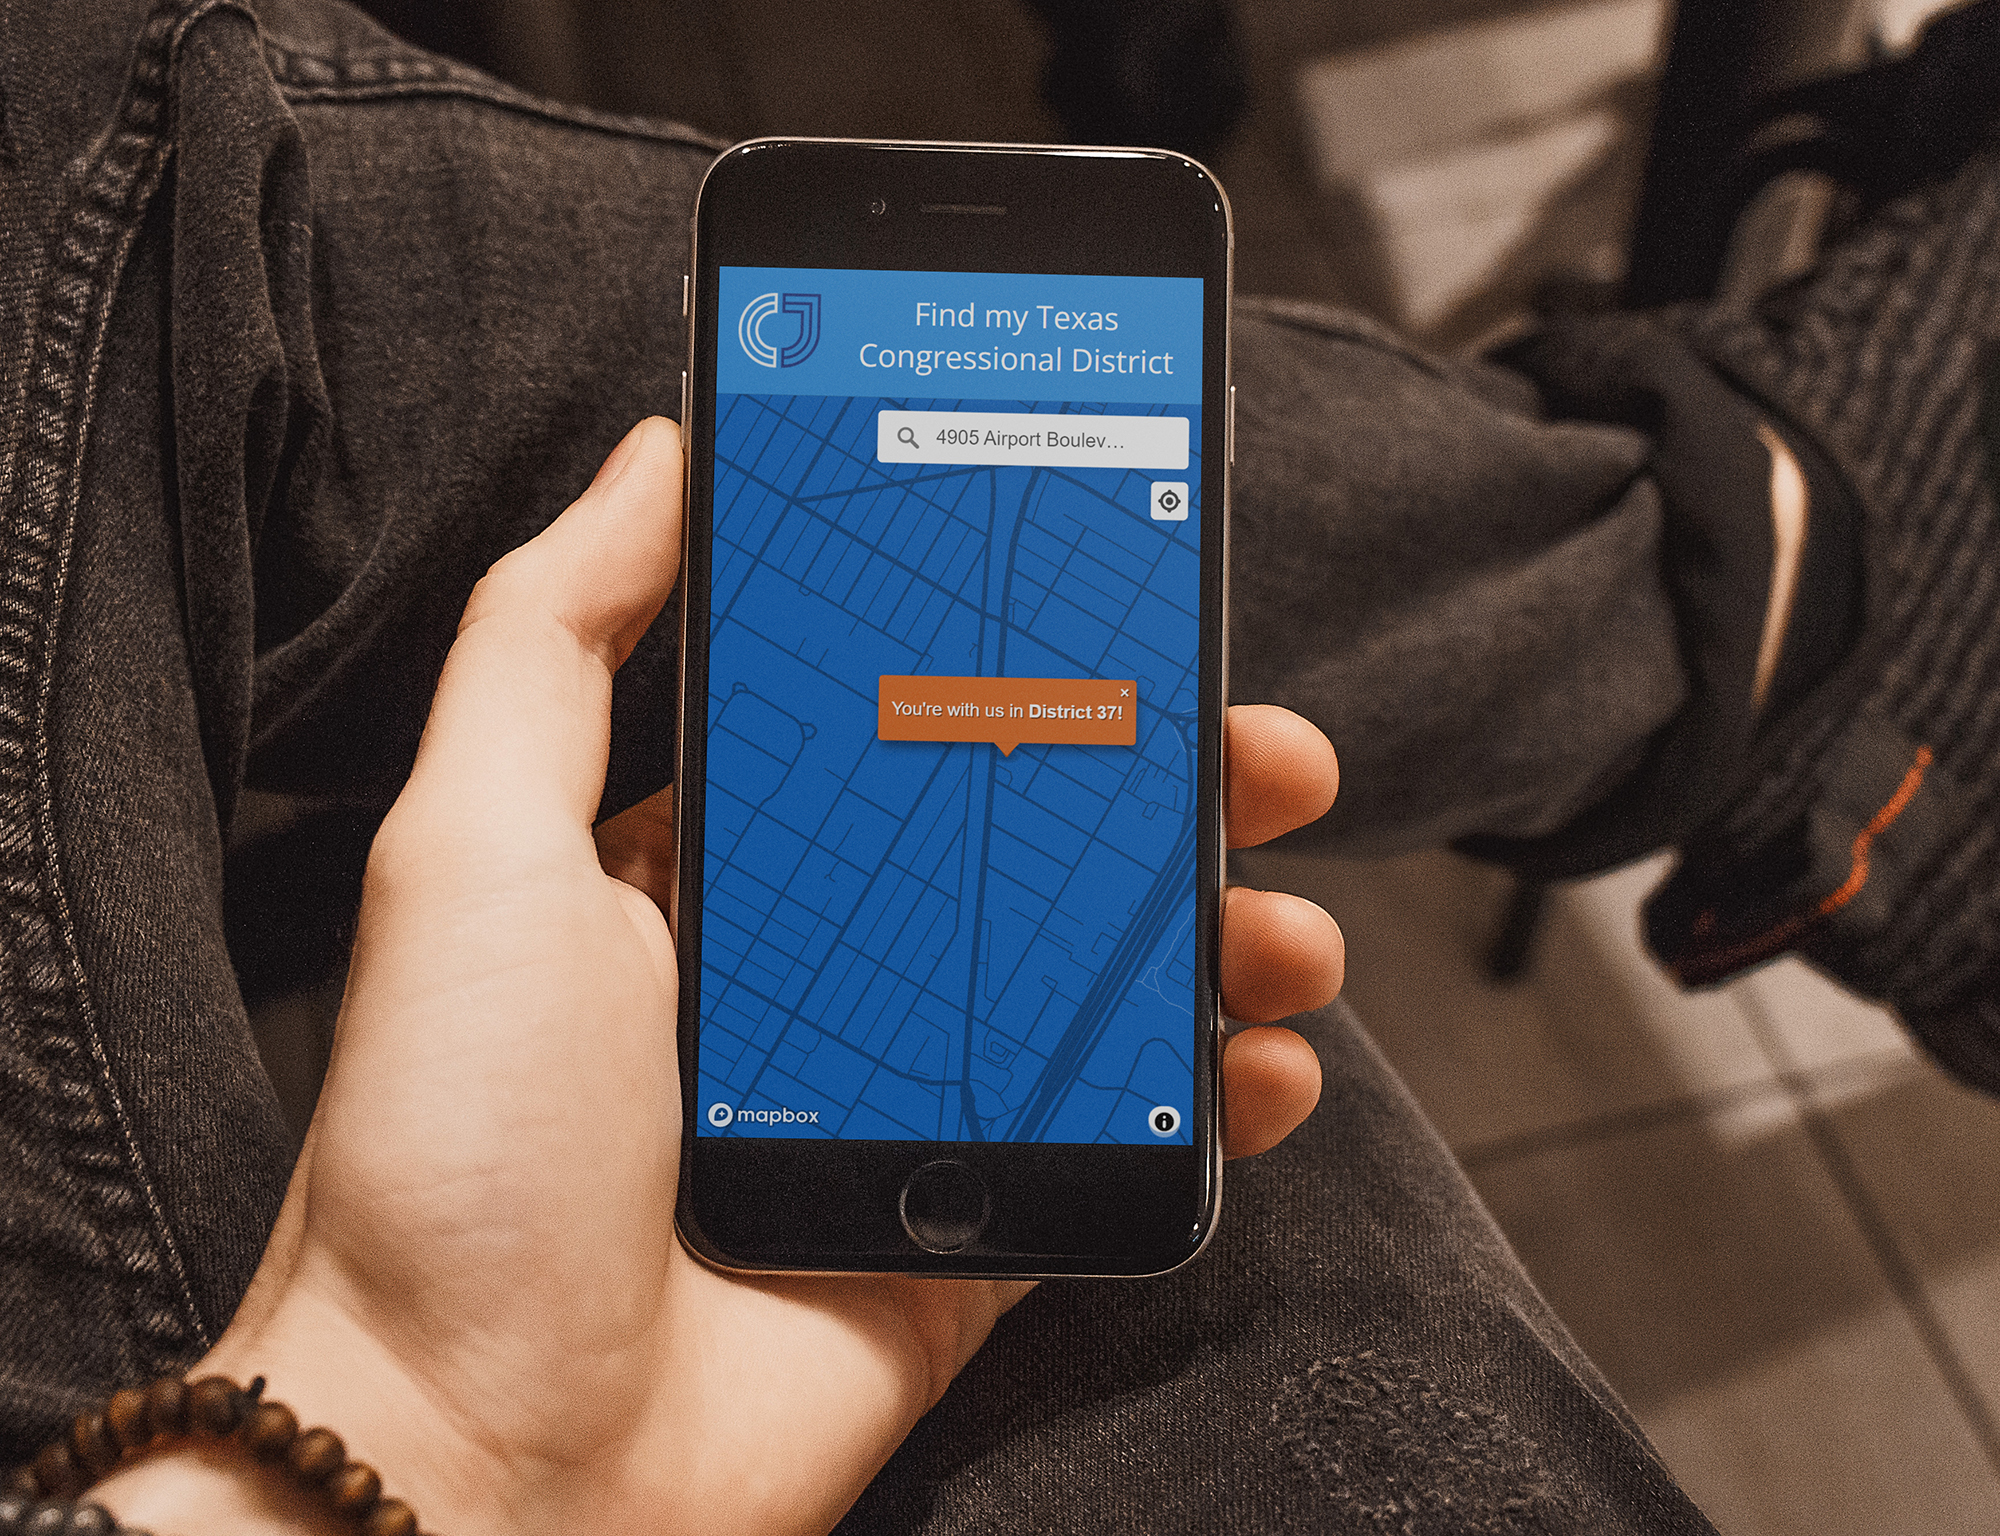
But what did we want users to do?

“Am I even in this district?”
Not everyone is a map nerd. We needed users potential voters to find their
district quickly and easily. I expected the bulk of traffic to be mobile, so I
wanted to allow three methods:
- Tap the map
- Search for an address
- Use device geolocation
Tap: mapbox-gl fires a click event when someone clicks or taps a point on
the map. The Event passed to the callback will have a lngLat object which
corresponds to the location the user indicated. That is easy to pass as-is to
our custom getTxDistrict callback detailed further down.
  map.on('click', (e) => {
    getTxDistrict(e.lngLat);
  });
Search: Mapbox provides a great geocoder search control in
another library.
It adds a simple search box in the top right corner of the map that offers
autocompletion of street addresses and handles all the API interaction
out-of-the-box. When a result is selected, the results payload includes a
center with coordinates for the given address.
  import MapboxGeocoder from '@mapbox/mapbox-gl-geocoder';
  const map = new Map({ /* ... */ });
  const accessToken = '...';

  const geocoder = new MapboxGeocoder({
    accessToken,
    marker: false,
    placeholder: 'Search by Address',
  }).setZoom(12);

  map.addControl(geocoder);

  geocoder.on('result', (results) => {
    const point = results.result?.center || false;
    if (point) {
      getTxDistrict({ lng: point[0], lat: point[1] });
    }
  });
Geolocation: Mapbox also has a built-in control for this, but while implementation was straightforward, our UX faced a complication. The campaign site on Wix would not allow geolocation permission to be passed to the embedded iframe. I didn’t want to show a disabled locate button — or worse — a clickable button that would error out.
Deep in mapbox-gl’s own GeolocateControl, there is a function to determine
if a browser or current viewport context allows access to the
Geolocation Web API.
I adapted this check from their checkGeolocationSupport() function:
  const ifGeoSupported = (callback: (x: boolean) => void): void => {
    let supportsGeolocation = false;

    if (window.navigator.permissions !== undefined) {
      // navigator.permissions has incomplete browser support
      // http://caniuse.com/#feat=permissions-api
      // Test for the case where a browser disables Geolocation because of an
      // insecure origin
      window.navigator.permissions.query({ name: 'geolocation' }).then((p) => {
        supportsGeolocation = p.state !== 'denied';
        callback(supportsGeolocation);
      });
    } else {
      supportsGeolocation = !!window.navigator.geolocation;
      callback(supportsGeolocation);
    }
  };
From there, when a user loads the page, if geolocation is supported by the
browser and device and also the site isn’t being accessed through the Wix
embed, it initializes the GeolocationControl and adds it to the map, which is
simple out-of-the-box. When geolocation is requested by the user, they will be
prompted for permissions. If provided, the data payload will have a coords
pair with the user’s GPS position, if successful.
  import { Map, GeolocateControl } from 'mapbox-gl';
  const map = new Map({ /* ... */ });
  const accessToken = '...';

  const setupGeolocator = (supported: boolean): void => {
    if (!supported) {
      return;
    }

    const locator = new GeolocateControl({
      positionOptions: {
        enableHighAccuracy: true,
      },
      fitBoundsOptions: {
        maxZoom: 12,
      },
      trackUserLocation: false,
      showUserLocation: false,
      showAccuracyCircle: false,
    });

    map.addControl(locator);

    /* eslint-disable  @typescript-eslint/no-explicit-any */
    locator.on('geolocate', (data: any) => {
      if (data && Object.prototype.hasOwnProperty.call(data, 'coords')) {
        const latLng = {
          lat: data.coords.latitude,
          lng: data.coords.longitude,
        };

        getTxDistrict(latLng);
      }
    });
  };

  ifGeoSupported(setupGeolocator);
LatLng Marks the Spot
Each of these event handlers passes the coordinates to a simple function that makes a Tilequery API request to ask, essentially, “what shape in the tileset contains this point?”
For example, what district is the Texas Capitol building in? (Ours!)
  {
    "type": "FeatureCollection",
    "features": [
      {
        "type": "Feature",
        "id": 37,           // <-- The answer
        "geometry": {
          "type": "Point",
            "coordinates": [
              -97.7405,
              30.2740
            ]
        },
        "properties": {
          "District": 37,   // <-- The answer also *
          "tilequery": {
            "distance": 0,
            "geometry": "polygon",
            "layer": "planc2193-b0e2m6"
          }
        }
      }
    ]
  }
*The district number is included both as the numeric ID of the polygon and also as the value for its “District” property.
After receiving the district information, getTxDistrict moves a
Marker and a Popup to the
search location. Then it adds a message explaining if the search is in our district,
a different district, or if there was an error (likely the search location was
outside of Texas).
  import { Map, Marker, Popup } from 'mapbox-gl';
  const map = new Map({ /* ... */ });
  const accessToken = '...';
  const tilesetId = '...';

  const marker = new Marker({
    color: '#D96523',
  });

  const popup = new Popup({
    className: 'district-popup',
  });

  /**
   * Look up a given position with Mapbox's Tilequery API to see what TX district
   * the position falls into and raise a popup on the map with the info.
   *
   * @param position (SimpleLngLat) position to query for
   */
  const getTxDistrict = (position: SimpleLngLat): void => {
    fetch(
      `https://api.mapbox.com/v4/tsmith512.${tilesetId}/tilequery/${position.lng},${position.lat}.json?access_token=${accessToken}`
    )
      .then((res) => res.json())
      .then((payload) => {
        const district = payload?.features[0]?.id || false;
        marker.remove().setLngLat(position).addTo(map);
        popup.remove().setLngLat(position).addTo(map);
        if (district == 37) {
          popup.setHTML(`You're with us in <strong>District 37!</strong>`);
        } else if (district) {
          popup.setHTML(`You're in <strong>District ${district}.</strong>`);
        } else {
          popup.setHTML(
            `We could not determine which Texas Congressional District this is.`
          );
        }
      });
  };
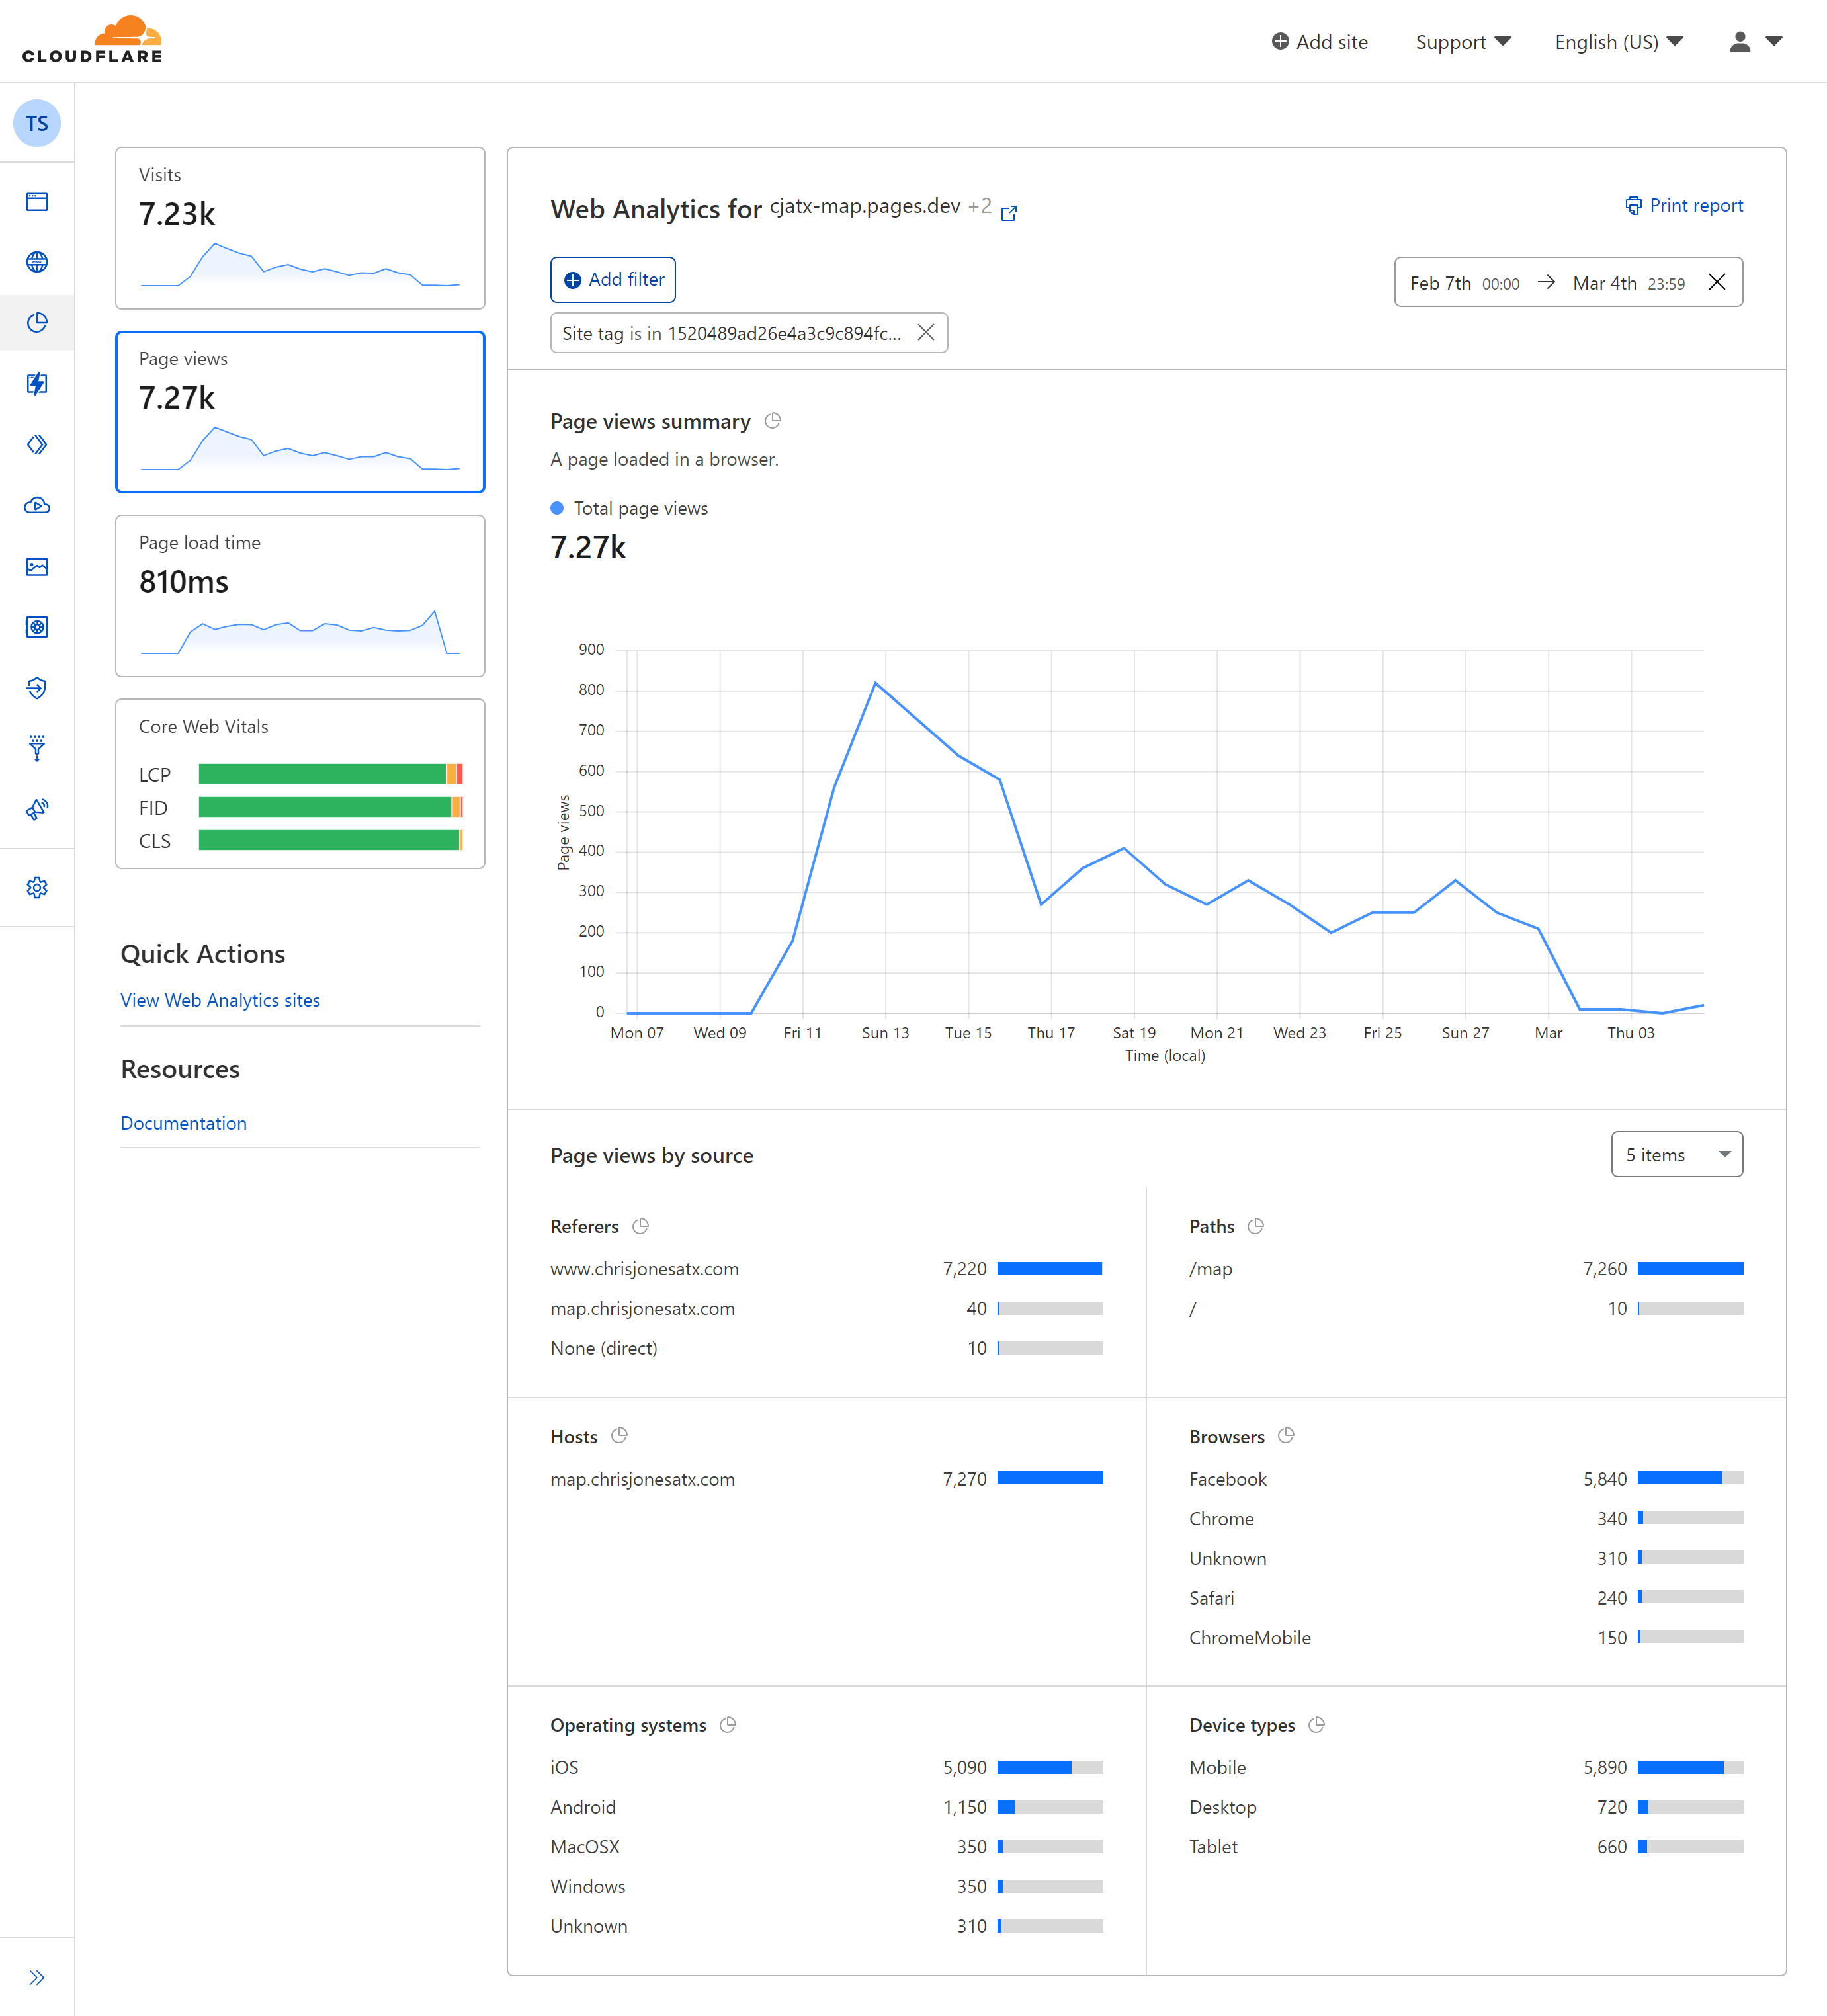
Static Site Hosting
I hooked up my repository to
Cloudflare Pages so for simple hosting
infrastructure and automatic deployments. Then I added map.chrisjonesatx.com
as a custom domain and turned on Web Analytics to get some basic stats.

Was it useful?
Throughout February, over seven thousand users visited the map, overwhelmingly mobile, largely seeing the embedded map on Wix, and referred from Facebook. According to Mapbox, in that same period, the Tilequery API served just over four thousand lookups.
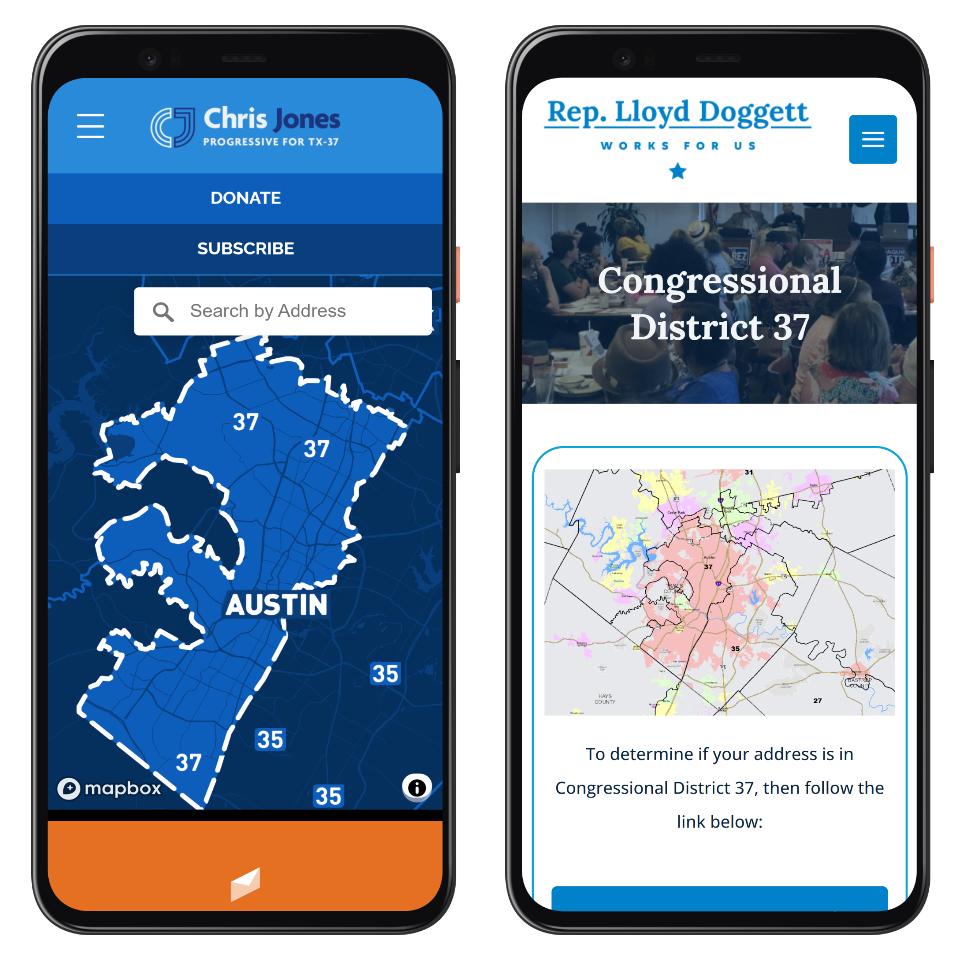
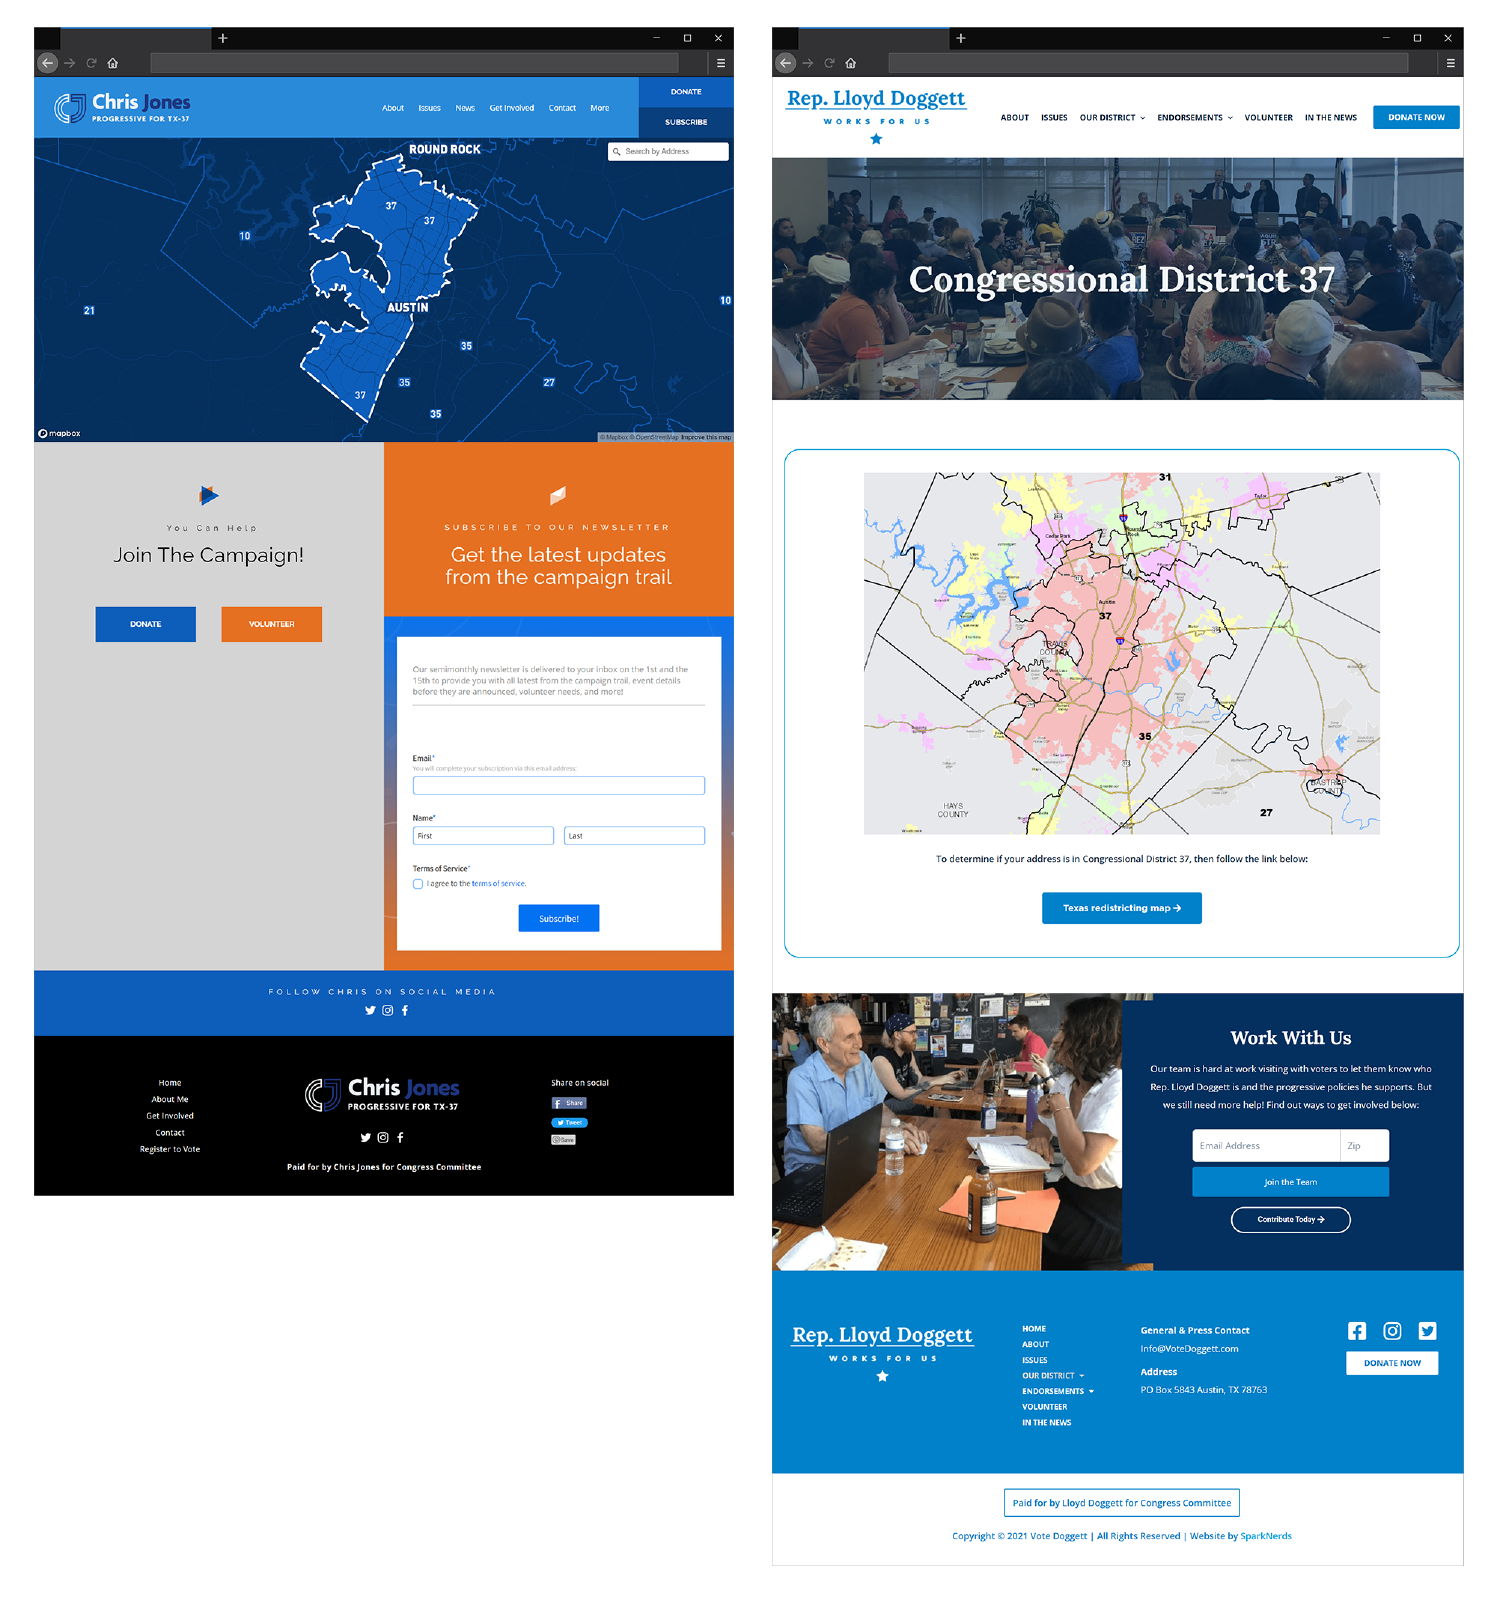
Anecdotally, the Casar campaign for East Austin’s 35th District reached out to say that they were using our map with their voters, too. Also, within days of us publicizing our map, the incumbent campaign added a screenshot of the Senate’s PLANC2193 (difficult to read) to their website and linked to the Texas Tribune’s interactive article on all Texas redistricting — which, while very informative, was both verbose and difficult to use on a mobile device.
I think that measures in at “well worth the effort” both as a campaign tool and an experiment. From my point of view, that can be expanded to my experience with the campaign generally. I was disappointed by the extent of the gatekeeping we experienced, but that only reinforced my opinion that more involvement from more people will yield more representative ideas. And everyone has something to offer.
Test it for yourself:
Printed material and static images use map data from Mapbox and OpenStreetMap and their data sources. © Mapbox © OpenStreetMap. Improve this map.
Other tooling and campaign material paid for by Chris Jones for Congress Committee.
Check out the code for the Chris Jones for Congress Map on GitHub.
Disclaimer: I am a Cloudflare employee, but our use of Cloudflare Pages and Cloudflare Web Analytics both fell within the limits of the free tier. The company neither endorses this candidate nor my work on this project specifically.